Salmonids: The status of Chinook salmon and cutthroat trout populations is generally good; the status of Coho salmon and
steelhead trout populations is variable, depending on stream
system.
Lamprey: More data are needed to understand the status and distribution of the two lamprey species native to the Coos water-
shed, which appear to be declining in abundance in Oregon.
Sturgeon: Little is known about the status of the two
sturgeon species found in the Coos system.
Other Fish: The Coos estuary supports more than 70 fish species but more information is needed to understand their populationsand life histories.
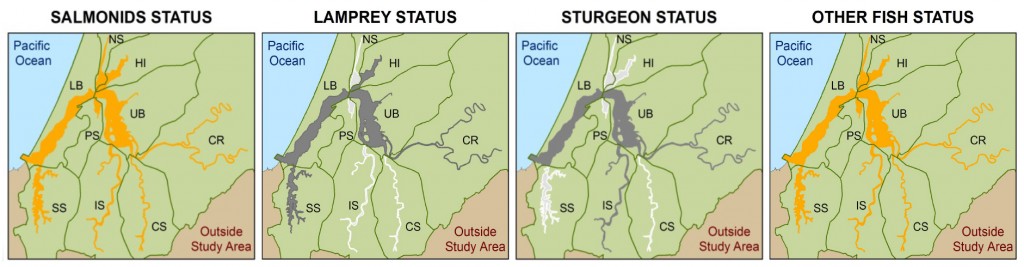
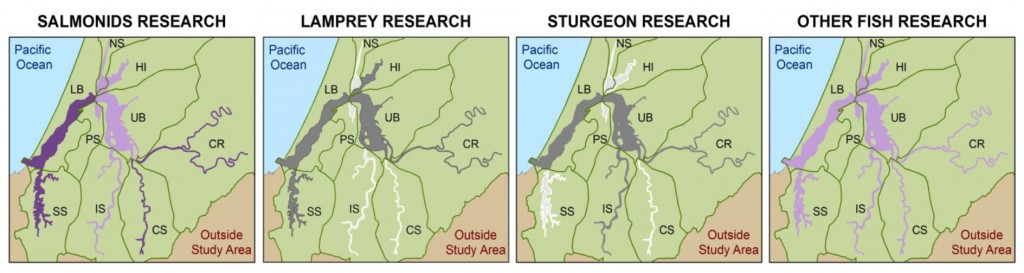
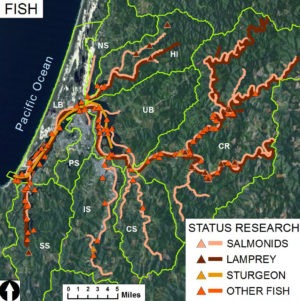
The two lateral maps shown above are color coded: Fish Status (top) Gray = Data Gap; Gold = Some Concern, closely monitor; White = Not Applicable; Green = OK, continue monitoring; and Research/Restoration (bottom) Gray = Data Gap; Light Purple = Ongoing Research; Dark Purple = Ongoing Research/Restoration; White = Not Applicable; Pink = Past Research.
The section below includes the following data summaries: Salmonids, Lamprey, Sturgeon, and Other
Fishes— which describe the status and trends (where the data allow) of fish in the Coos estuary and major freshwater tributaries in the lower Coos watershed.
The data presented in this chapter cover fish abundance and distribution at both the watershed and subsystem scales. At the watershed scale, the OASIS project provided abundance and distribution data for both adult Coho salmon and adult winter steelhead trout (ODFW 2013e; ODFW 2013f; Suring and Lewis 2008; Suring et al. 2008;Brown and Lewis 2009 & 2010; Brown et al. 2011, & 2012; Jacobsen et al. 2013). OASIS data were collected at 24 Oregon coast sites for Coho salmon and 13 sites for steelhead. The most recent OASIS data are from 2012, but the project also provides historic data for both Coho salmon and steelhead trout, dating back to 1990 and 2003 respectively. Adult Chinook abundance data were provided by ODFW spawning survey summaries, with the most recent data coming from 2013 (ODFW 2002, 2003, 2004, 2005d, 2006, 2007, 2008, 2009, 2010, 2011, 2012, & 2013d). An unpublished manuscript of ODFW’s 2014 Coastal Multi-Species Conservation Management Plan was also referenced (ODFW 2014). Historic adult Chinook data (1974-2002) came from the 2005 Oregon Native Fish Status Report (ODFW 2005c).
At the subsystem-level, the most robust data are available from the Coos River and Haynes Inlet subsystems. In these basins, Coos Watershed Association (CoosWA) spawning surveys provided recent data (up to 2011) for Coho salmon (CoosWA 2011). Data for the South Slough subsystem are available from the Life Cycle Monitoring Program (Suring et al. 2012). These data were collected most recently in 2012.
The use of multiple metrics to estimate salmonid abundance is another limitation. Among the estimation methods are: mark-recapture surveys, area-under-the-curve (AUC) modeling, redd counts, and density based on fish observed per mile of river at peak count. Time series comparisons are possible when the data are sufficiently robust and survey/modeling methods are consistent between years. Comparisons of data collected by different organizations are possible if surveying methods have been standardized. In addition, comparisons based on different abundance metrics have been made with caution, to avoid misleading or inaccurate interpretations. Some metrics can be converted to facilitate comparison. For example, peak count data (number of fish observed) can be converted to density data (fish per mile) by dividing the count at a site by the length of the associated survey section. When conversion is not possible, separate presentations of the data were warranted.
Aggregation of salmonid data also prohibits certain analyses. For example, the Coos River was grouped with the Tenmile, Coquille, Floras, and Sixes Rivers for a regional abundance estimate in ODFW’s 2013 OASIS Winter Steelhead Assessment Report (Jacobsen et al. 2013). Although regional aggregations are useful for statewide comparisons they may overestimate salmonid abundance in the Coos watershed alone.
Lamprey: There are no historic or current abundance estimates to determine status or trends for either lamprey species in the state of Oregon. Distribution information is also lacking for both lamprey species due to the difficulty in identifying ammocoetes (juveniles) by species (ODFW 2005c). Moreover, there is little life history information for either species in the Coos estuary. Detailed life history information for western brook lamprey is especially limited (ODFW 2005c).
Sturgeon: Information about abundance, distribution, and life histories of both white and green sturgeon in the Coos watershed is sparse. Neither past nor present abundance data for coastal white sturgeon exist. (ODFW 2005b). Similarly, very little is known about the status of green sturgeon populations, and the available abundance data are inconclusive (ODFW 2005a). More research is needed to alleviate these gaps (Wagoner et al. 1990).
Other Fish: Large data gaps exist for evaluating status and trends of “Other Fish” populations. The most complete assessment of life history data comes from a report by Monaco and Emmett (1990) describing annual distribution and abundance changes by age classes for 36 fish species in 32 West Coast estuaries. The distribution of each species in a particular estuary is based on salinity zones. However, a major limitation of this report is that the quality and quantity of data vary by species with some data derived from considerable field sampling and some based on best professional judgment. This report is also over 20 years old.
Another report from that time period is the Coos River Basin Fish Management Plan by Wagoner et al. (1990). Although this report focused on the Coos system, it primarily highlighted the lack of sampling data for non-salmonid populations. The objectives of the report were to prioritize the issues affecting the Coos system and to assess funding for fish research and monitoring. For example, one of the highest priorities was collecting baseline information on endemic Millicoma dace (Rhinichthys cataractae ssp.), but research and monitoring funds were lacking.
Our summary of Other Fish was mostly developed from raw data in two research projects– one by the Oregon Institute of Marine Biology (OIMB 2013), and a long term monitoring project by the Oregon Department of Fish and Wildlife (ODFW 2013a). The OIMB dataset was limited in scope (i.e., data only from summer 2013) but included accurate fish identifications. Although the ODFW dataset is from an on-going project and includes extensive data dating back to 1965, the project goals and sampling methods have shifted over time, thereby limiting its utility for quantifying fish populations. Some of the inconsistencies include: relocated sampling stations, varying confidence in fish identification between surveyors, estimates in population numbers, and differing seining dates between years.