What’s happening?
In summarizing available information about terrestrial vegetation in the lower Coos watershed, we discuss forest structure (e.g., old-growth structure vs. younger forests), forest fragmentation, vegetation type, species and common associates, and the status and causes of damaged and diseased forests.
The report describes a nearly 5% region-wide net loss of LSOG forests on forested lands between 1996 and 2006. Losses on federal lands, nearly all of which occurred in forest reserves, were generally caused by stand-replacing disturbances such as wildfire. In contrast, of the known causes of LSOG forest losses on non-federal lands, harvesting was the highest. Moeur et al. (2011) also examined the region by physiographic provinces, including the Oregon Coast Range, which encompasses the project area (the lower Coos watershed).
Figure 1. Area of late successional and old-growth forest as compared to younger forest lands on federal, non-federal and all lands combined in the Oregon coast range. Non-federal lands include state, tribal, and private ownership. Data: Moeur et al. 2011
There’s no single agreed-upon definition of late successional and old-growth forests. Older forests have distinctive structural features; therefore, a suite of factors should be considered in addition to tree age when determining late successional and old-growth forest characteristics. Among these are: diameter at breast height (DBH) and height of dominant trees, density and diameter of snags, canopy tiers, understory cover, density and diameter of downed logs, and tree biodiversity.
Sources: Bingham and Sawyer, Jr. 1991; Ohmann et al. 2012
Net LSOG losses in the Oregon Coast Range were over 17% (123,000+ acres) from 1994-2006. Almost 40% of losses were attributable to timber harvest activities while over 60% of the losses were unexplained.
The Moeur et al. (2011) report found nearly 23% of the “forest-capable” land in the Oregon Coast Range contained LSOG forests in 2006 (Figure 1).
In contrast, Rapp (2003) reported that old-growth forests (defined as those where the upper canopy is dominated by trees older than 200 years) would historically (over the last several thousand years) have covered 30-70% of the forested land in the Oregon Coast Range at any one time.
Additional information about LSOG forests is available from the Landscape Ecology, Modeling, Mapping and Analysis (LEMMA) research team (collaboration between United States Forest Service’s [USFS] Pacific Northwest Research Station and Oregon State University [OSU]) and their online database.
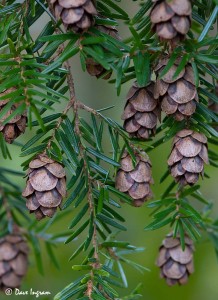
Western Hemlock Cones
The LEMMA team investigated LSOG forests in the Pacific Northwest using their regional GIS model of forest structure coverage based on 2012 Landsat imagery (LEMMA 2014b). They used an old growth structure index (based on stand age, density of large live conifers and large snags, volume of downed wood, and tree size diversity) to analyze their project area for forest structures indicating 80 year or older forests (mature) and those structures indicating 200 year or older forests (LSOG), as recommended by Ohmann et al. (2012). Mature forests are those that have a majority of trees reaching maximum heights, which for Douglas-fir occurs at the age of about 80 years (Rapp 2003).
Results show that mature forests cover ~43 mi2, or nearly 18%, of forested land in the project area, while LSOG forest structure can be found on ~15 mi2 or 6% of forested land (Figure 2). Mature forests in the project area were most likely to occur on private forest lands which comprise over 73% of all project area forests (Figure 2).
The LEMMA team quantified mature and LSOG forest coverage as a percentage of total landowner forestland holdings (Figures 3 and 4). State owned lands contained the greatest percentage of mature forest coverage in the project area (over 33% or ~13 mi2), primarily in the Elliot State Forest; federal lands contained over 30% (or ~5 mi2); and private lands contained approximately 14% (or ~24 mi2)(Figure 3). Local ownership (City and County lands) contained the lowest percentage of mature forest.
For LSOG forest coverage (Figure 4), state lands contained the highest percentage (nearly 20% or ~8 mi2), concentrated in the Elliot State Forest (Figure 2); federal lands contained nearly 12%, primarily on United States Bureau of Land Management (BLM) holdings; private lands contained only ~3%. Local ownership contained the lowest percentage of LSOG forest coverage.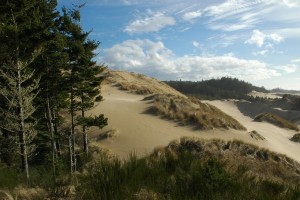
Dune habitats on the Oregon coast provide dynamic microhabitats that benefit a variety of plant communities. Dune forest communities are often engulfed by moving sand; however in areas of minimal activity (e.g. in deflation planes where high water tables effectively stop sand movement), dune forests develop with shore pine as an early seral species, replaced by the longer-lived Sitka spruce, and finally western hemlock as the climax species. In wind-exposed, unstabilized dune areas, low-lying herbaceous plants (e.g., lupine [Lupinus littoralis]) dominate but have a low percent cover (10%), while the more wind-protected dune edges are aggressively colonized by various grass species (e.g., Festuca rubra) and herbs (e.g., western pearly everlasting) in plant communities with percent coverage as great as 94%.
Sources: Franklin and Dyrness 1973, Kumler 1969
Figure 2. Distribution of late successional forests (> 200 years old) and mature forests (> 80 years old) in the project area. Land ownership categories are also indicated. Federal holdings include US Army Corps of Engineers, US Bureau of Land Management, and US Forest Service. State holdings include OR Department of State Lands, OR Parks and Recreation Department, and OR Department of Forestry. Local governments (cities) and Coos County lands are grouped together. Tribal lands were not designated in this data set. Data: LEMMA 2014b; ODF 2014a.
Figure 3. Distribution of mature forest by land ownership in the project area. Federal lands include those held by US Army Corps of Engineers, US Bureau of Land Management, and US Forest Service. State lands include those held by OR Department of State Lands, OR Parks and Recreation Department, and OR Department of Forestry. City and Coos County lands are grouped together as local ownership. Tribal lands were not designated in this data set. Data: LEMMA 2014b; ODF 2014a.
Figure 4. Distribution of late successional and old growth forests (LSOG) by land ownership in the project area. Federal lands include those held by US Army Corps of Engineers, US Bureau of Land Management, and US Forest Service. State lands include those held by OR Department of State Lands, OR Parks and Recreation Department, and OR Department of Forestry. City and Coos County lands are grouped together as local ownership. Tribal lands were not designated in this data set. Data: LEMMA 2014b; ODF 2014a.
Figure 6. Distribution of gains and losses of each forest fragmentation class from 1996 to 2010. Gains/losses are conversions from non-forest lands as well as from other forest fragmentation classes. Data: C-CAP 2014
According to the C-CAP database, net forest coverage in the project area declined from 60% to ~50% between 1996 and 2010 (Figure 5). Eight square miles of non-forested land were converted to forest during that period, while 37 mi2 of forest were converted to non-forested land. Of the forested lands lost to non-forest lands, 76% (28 mi2) were classified as core forests. Core forest classes experienced the greatest net decrease (from nearly 44% in 1996 to 32% in 2010)(a gross loss of 38 mi2) which includes conversion of core to other forest fragmentation types (Figure 6). Patch and edge forest types had slight net gains due to conversion from core forest. The spatial extent of the gains and losses of core forest can be seen in Figure 7.
When fragmentation data were further broken down by subsystem, the highest gross loss of core forest land area (as a percentage of total land area in the subsystem) was found in the Coos River subsystem (~18%) followed by South Slough (~16%)(Figure 8). The lowest percentage of core forest loss occurred in the Lower Bay subsystem, which also happens to include very little forested land.
Figure 8. Distribution of gains and losses of core forest from 1996 to 2010 at each subsystem as a percentage of square miles/total subsystem land area. Gains/losses are conversions from non-forest lands as well as from other forest fragmentation classes. Data: C-CAP 2014.
Figure 7. Gains, losses and remaining core forest from 1996 to 2010 in each subsystem. Gains/losses are conversions from non-forest lands as well as from other forest fragmentation classes. Data: C-CAP 2014
Figure 11. Net loss of all forest types (evergreen, deciduous and mixed) to different land cover type categories from 1996 to 2010. “Bare” land covers include unconsolidated shores, and barren lands. “Developed” groups low, medium and high intensity development with developed open space. “Agriculture” combines pasture/hay with cultivated crop land. Data: C-CAP 2014
In addition to forest fragmentation, the NOAA C-CAP program provided information about land cover classes. In the project area, all forest cover classes, including deciduous, evergreen, mixed (both deciduous and evergreen), and palustrine (freshwater wetlands dominated by woody vegetation), experienced a net decrease of over 28 mi2 between 1996 and 2010. This represents a decrease of forest land cover in the project area (~315 mi2) from 59% in 1996 to 50% in 2010 (Figure 9). By contrast, lands identified by C-CAP as scrub/shrub cover (areas dominated by young trees and shrubs) increased by 36 mi2, from 10% in 1996 to over 21% in 2010. In fact, the greatest shift in vegetation cover in the project area was the conversion of forest cover classes to the scrub/shrub cover class. Over 18 mi2 of forested land were converted to scrub/shrub during the 14 year study period (Figures 10 and 11).
Figure 12. Distribution of gains and losses of forest and scrub/shrub cover from 1996 to 2010. Data: C-CAP 2014
Conversion to grasslands was the next greatest shift in vegetation cover, with nearly 8 mi2 of forest land converted to grasslands. Note that C-CAP’s “scrub/shrub” and “grassland” designations are most likely timber harvest areas at different stages of re-growth (younger = grasslands; older = scrub/shrub). Conversion from forest land cover to barren, developed, and agricultural cover (cultivated crops and pasture land) was also notable.
The greatest net change in forest type was in evergreen forests (decreased from 36% to 31%). Evergreen forests also had the highest gross loss (24 mi2 lost )(Figure 12), followed by mixed forests with a loss of just over 13 mi2. The greatest net gain to scrub/shrub lands (over 18 mi2) was due to conversion from forested lands, followed closely by conversion from grasslands (nearly 16 mi2)(Figures 10 and 13). Total (gross) gains in scrub/shrub land numbered over 42 mi2 (Figure 12).
As noted previously, many of these reported changes, particularly changes from forest to scrub/shrub or grassland cover classes, are likely the result of timber harvest activities and therefore occur frequently in the project area. Because of sizable land ownership in the project area by industrial and small lot timber producers, it’s not surprising that changes in forest cover in the project area is so dynamic.
Figure 10. Land cover change from 1996 to 2010. Dark green colors represent forest cover; light green colors delineate scrub/shrub cover. Data: C-CAP 2014
Figure 9. Percent scrub/shrub and three forest types in the project area (deciduous, evergreen and mixed) in 1996 and 2010. Data: C-CAP 2014
Figure 5. Net change in forest fragmentation classes from 1996 and 2010. Core = forest surrounded by forest; Edge = forest on the edge of a core forest; Perforated = forest within core forest next to small clearings; Patch = small fragments of forest. Data: C-CAP 2014
When analyzing spatial extent of each species, Douglas-fir and western hemlock (Tsuga heterophylla) were distributed fairly evenly across the entire project area (Figure 15). Shore pine (Pinus contorta), Port-Orford-cedar (Chamaecyparis lawsoniana), and Sitka spruce (Picea sitchensis) were concentrated closer to the coast while western redcedar (Thuja plicata) and red alder (Alnus rubra) were concentrated more inland.
Figure 14. Percent cover of dominant tree species in the forested regions of the project area. Incense cedar (Calocedrus decurrens) dominated 1% of the project area according to the data, but was changed to “Unknown cedar” since incense cedar is not known to occur near the coast. The category “Other” includes combined cover from species that are dominant in less than 1% of the forested area, including: white fir, grand fir, white fir/grand fir cross, bigleaf maple, vine maple, white alder, and bay laurel. Forest land that was not tallied by species is designated “Unknown”. Data: LEMMA 2014a
LEMMA quantified species richness, an important indicator of forest status, for project area conifer and hardwood forests (Figure 16). Coniferous species richness was high in the entire project area, but highest in the areas closest to the coast, particularly in the South Slough watershed. Species richness for hardwood species was higher in regions further inland. In the entire project area, coniferous tree species richness was higher than that of hardwood tree species.
The model also characterizes understory species distribution (both herbaceous and woody species). Western sword fern (Polystichum munitum) was by far the most dominant understory species in the project area, followed by evergreen huckleberry (Vaccinium ovatum), salal (Gaultheria shallon) and Salmonberry (Rubus spectabilis)(Figures 17 and 18). Over 30 species are present in less than 1% of the project area’s forests including elderberry (Sambucus spp.), blackberry (Rubus spp.), huckleberry (Vaccinium spp.), and thimbleberry (Rubus parviflorus). All dominant understory vegetation are listed in Table 1.
Figure 17. Percent cover of dominant understory species in the project area. The category “Other” includes combined cover from 33 species that are dominant in less than 1% of the project area, including: elderberry, various blackberry species, thimbleberry and foxglove. Non-forest land and land not tallied by species is designated “Unknown”. Data: LEMMA 2014a
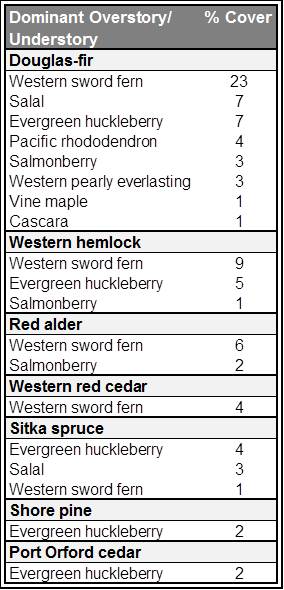
When dominant tree species were compared with dominant understory species, Douglas-fir/western sword fern emerged as the most common association (Table 2). Western hemlock/western sword fern, Douglas-fir/salal, and Douglas-fir/evergreen huckleberry were also common associates. The greatest variety of understory associates were found in Douglas-fir dominated forests, followed by western hemlock and Sitka spruce dominated forests.
Figure 13. Net gain to scrub/shrub lands from three land cover type categories from 1996 to 2010. “Bare” land covers include unconsolidated shores, and barren lands. “Forest” lands group evergreen, deciduous and mixed forest types together. Data: C-CAP 2014
Figure 15. Land cover by dominant tree species in the project area. Dominant species with less than 1% cover across the project area are not shown (e.g. white fir, grand fir, white fir/grand fir cross, bigleaf maple, vine maple, white alder, bay laurel). Data: LEMMA 2014a
Figure 18. Spatial cover of the most dominant understory species in the project area. Dominant species with less than 1% cover across the project area are not shown. Data: LEMMA 2014a
Figure 16. Conifer and hardwood tree species richness in the project area. Lighter colors indicate fewer species counts than darker colors. Conifer species include but are not limited to: Douglas-fir, Port-Orford-cedar, incense cedar, western redcedar, western hemlock, shore pine, white fir, grand fir, and Sitka spruce. Hardwood species include but are not limited to: red alder, white alder, bay laurel, vine maple, and bigleaf maple. Data: LEMMA 2014a
Table 1. Complete list of dominant understory vegetation in the project area. * Species that are not native to the project area. Data: LEMMA 2014a
Swiss Needle Cast (SNC)(Phaeocryptopus gaeumannii), an endemic fungus that targets Douglas-fir trees, is the primary cause of tree damage in the project area. The effects of SNC are monitored annually by aerial surveys conducted by Oregon Department of Forestry (ODF). Results from 19 years of surveys (1996-2014) indicate the highest incidence of SNC in western Oregon occurred the last four years of the surveys (2011-2014), each successive year reaching an “all time high” for observed SNC symptoms (Kanaskie and Norlander 2014).
Figure 19. Total square miles in the project area affected by Swiss needle cast disease from 2006 to 2014. Data from 2008 were incomplete, and thus were excluded from this analysis. Data: ODF 2014b.
ODF (2014b) SNC aerial survey results for the project area from 2006 to 2014 show the highest extent of SNC-damaged trees occurred in 2011 (over 79 mi2) followed closely by SNC damage in 2014 (over 78 mi2)(Figure 19). Surveyors classified affected areas as “severe” (extremely sparse crowns and brown foliage) or “moderate” (yellow foliage and slightly sparse crowns). The most extensive “severe” SNC damage was seen in the 2011 survey (nearly 11 mi2). The smallest area with “severe” SNC damage was seen in the 2006 survey, which also showed the smallest area affected by SNC. Figure 20 shows the spatial extent of SNC based on 2006 and 2011 survey data.
Since 1947, USFS and ODF have conducted annual aerial surveys across Oregon and Washington to assess damage to forests by agents other than SNC (USFS 2014). Results clearly demonstrate that the greatest non-SNC damage to forests in the project area is caused by Port-Orford-cedar root rot (Phytophthora lateralis)(POCRR), a non-native fungus which targets Port-Orford-cedar trees (Figure 21). Ten years of survey results (2004-2013) indicate particularly high incidence of POCRR damage in 2006, 2007 and 2008 (2006 results: over 3,700 acres [~5.8 mi2] damaged); the 2012 survey results showed the least damage (~650 acres [~1.0 mi2] damaged).
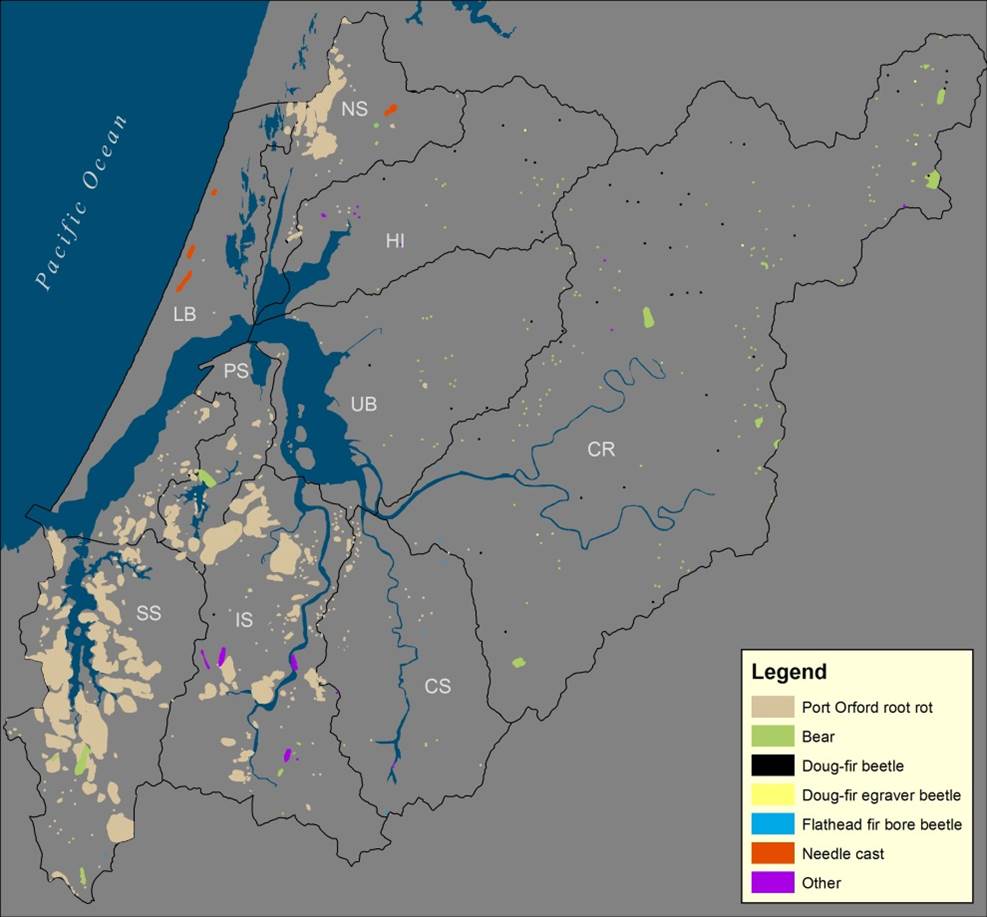
Figure 22. Distribution of forest land damaged by insects, disease or environmental events from 2004-2013. Subsystems are labeled as follows: CR – Coos River; CS – Catching Slough; HI – Haynes Inlet; IS – Isthmus Slough; LB – Lower Bay; PS – Pony Slough; UB – Upper Bay; SS – South Slough. Data: USFS 2014.
POCRR damage is concentrated in forested lands closer to the coast (particularly South Slough, Isthmus Slough, and North Slough subsystems)(Figure 22). Effects of POCRR were most evident in the South Slough subsystem, likely explained by the lack of extensive upland management in South Slough Reserve forests since the early 1970’s which resulted in the accumulation of diseased Port-Orford-cedar trees identified in the surveys. Both diseased and disease-free Port-Orford-cedars have been removed in the other more actively managed project area forest lands. In fact, we should note that extensive forest management practices in the project area is a factor to consider when evaluating disease damage survey results (e.g., SNC, POCRR). Variable harvest levels in any given year will affect the number of diseased trees observed.
In the South Slough Reserve, where 62% of Port-Orford-cedars were dead or dying from POCRR in 2011 (Cornu et al. 2012), several projects are underway using POCRR-resistant Port-Orford-cedar seedlings for upland restoration or long-term field trials. In spring 2013, 825 tagged disease resistant Port-Orford-cedar seedlings were planted among 110 tagged naturally recruited seedlings at three sites in the South Slough Reserve as part of remnant logging road restoration efforts. Monitoring results in 2014 showed survival rates for naturally recruited seedlings at ~83%, compared with ~89% for the disease resistant seedlings (Figure 23). Only one tagged naturally recruited seedling did not survive while 44 or ~5% of the disease resistant seedlings had died. However, many of the tagged naturally recruited seedlings were not found (~16%).
We assume at least some of these seedlings were not survivors. In addition, several tags were found unattached to seedlings. At the seedling stage, it’s unlikely that mortality was caused by POCRR; it’s more likely that many of the seedlings died from especially dry conditions in 2013. In addition, seedlings were planted and had naturally recruited in both compacted road bed soils and un-compacted roadside soils. The data have not yet been analyzed to quantify the effects of compacted soils on seedling mortality. It’s should be noted that the Port-Orford-cedar seedlings were from an “open-pollinated orchard” so only a subset of those seedlings would show resistance to POCRR.
Figure 23. Percentage of Port-Orford-cedars from the 2014 survey that were live, dead or not found. Numbers next to Tree Type categories are the number of trees identified (Natural) or out-planted (Resistant) in 2013. Data: SSNERR 2014.
Since genetically different Port-Orford-cedar trees have different resistance to POCRR, USFS has been identifying and collecting disease-resistant strains from natural cedar stands. Long-term field trials on these disease resistant strains are essential for understanding their “durability” under a variety of environmental conditions (Sniezko et al. 2012).
In cooperation with the South Slough Reserve, USFS implemented long-term field trials at three locations within the Reserve in 2011 and 2012 by outplanting a diverse assortment of genetic strains of Port-Orford-cedar beneath a canopy of large dead and living Port-Orford-cedar. Early results from 2014 have shown that mortality varies between 6% and 45% depending on both genetic strain and location (Sniezko 2014). A direct link between seedling mortality and POCRR presence has not yet been established. Care will be taken to factor in non-POCRR related mortality (e.g., environmental stressors).
Figure 20. Spatial extent of Swiss needle cast disease in Douglas-fir populations in the project area in 2006 and 2011 (the lowest and highest (respectively) SNC occurrences betrween 2006 and 2014). Data: ODF 2014b.
The complex structure of old-growth forests provides diverse habitat which supports the rich biodiversity found in older forest ecosystems (Means et al. 1996). In general, complex forest structure contains more microhabitats for a larger variety of species, which in turn provides more diverse food resources (Brokaw and Lent 1999). For example, insect species richness and density increases with forest age and complexity in Oregon Douglas-fir forests (Schowalter 1995 as cited in Brokaw and Lent 1999).
Spatial complexity is one of the key components underlying this habitat diversity. Standing snags scattered among living trees provide microhabitats for a wide variety of organisms (e.g., invertebrates and woodpeckers). Large conifer (≥40 cm DBH and ≥4 m tall) snag density in southern Oregon Douglas-fir dominated old-growth forests is typically very high (Bingham and Sawyer, Jr. 1991).
Snag longevity and probability of containing cavities suitable for bird nesting increases with snag diameter, an important feature since up to 40% of bird species in North America are cavity nesters (Scott et al. 1977 as cited in McComb and Lindenmayer 1999).
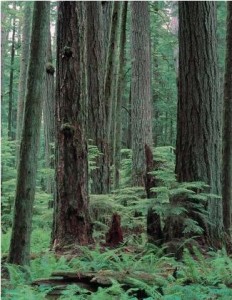
Temperate rainforests on the coast (including those in the project area) are subject to infrequent fires, are almost completely dominated by conifers, and have a highly complex structure (due to large size of mature trees, diversity of epiphytes [plants that grow on other plants but are not parasitic], and dense shrubby understory). Local temperate rainforests include some of the largest representatives of Pacific Northwest conifer species.
Sources: Pojar and MacKinnon 2004, Franklin and Dyrness 1973
Likewise, downed wood is a source of nutrients as nursery logs (fallen trees that decay and contribute to forest soil development). Interestingly, in young forests a high abundance of wood can be found on the forest floor (especially those with a history of timber harvest) while older forests in areas subject to regular fires can include very little downed wood (Bingham and Sawyer, Jr. 1991). Size of wood is important, as large pieces can provide habitat for numerous species for centuries (Tyrrell and Crow 1994).
Fragmentation
Forest fragmentation occurs when forests become divided into an ‘archipelago’ of small isolated ‘island’ stands in a sea of non-forest ecosystems due to natural disturbance (e.g., fire) or human activities (e.g., roads, agriculture, urbanization)(Haila 1999). Determining the extent of forest fragmentation helps determine the status of the forest ecosystem– including biological diversity and air and water quality. Fragmented forests are more susceptible to attacks from insect or disease and often are stressed to a point of chronically unhealthy conditions (Lynch and Swetnam 1992 as cited in Spies and Franklin 1996).
Animal species that depend on intact forest structures are affected by extensive forest fragmentation. For example, spotted owl ranges were found to be 85% more expansive in heavily fragmented forests compared with spotted owls inhabiting lightly fragmented areas (Carey et al. 1990). In addition, patchy forest stands prevent the establishment and maintenance of stable animal travel corridors for larger mammals (e.g., wolves: Jȩdrzejewski et al. 2004).
Forest fragmentation creates more edge forests, which can lead to destructive edge effects such as windthrow (Haila 1999). Human-caused forest edges are commonly uniform, following rectininear property lines, in contrast to naturally complex, jagged edges caused by natural disturbance (e.g., from fire) which provide greater spatial diversity in the landscape (Matlack and Litvaitis 1999). Matlack and Litvaitis (1999) also describe edge zones as often hotter, drier, and having more light and wind exposure than non-fragmented forests (or “core” forests).
Species
The project area falls within the United States Environmental Protection Service’s (USEPA’s) Coast Range Ecoregion (Thorson et al. 2003). The Coast range ecoregion comprises seven subregions, three of which are represented in the project area:
1a Coastal Lowlands, characterized by the following terrestrial vegetation species: Sitka spruce, western hemlock, Douglas-fir overstory; salal, western sword fern, vine maple (Acer circinatum), and Oregon grape (Mahonia aquifolium) understory; red alder, western redcedar, bigleaf maple (Acer macrophyllum) and salmonberry in riparian areas; stabilized dunes are dominated by shore pine, salal, rhododendron (Rhododendron spp.), and evergreen huckleberry.
1b Coastal Uplands characterized by the following species: Douglas-fir, and/or western hemlock overstory; salal, sword fern, vine maple, Oregon grape, rhododendron, and evergreen huckleberry understory; red alder, bigleaf maple, western redcedar and salmonberry in riparian areas.
1g Mid-Coast Sedimentary characterized by the following species: Douglas-fir, and/or western hemlock overstory; salal, sword fern, vine maple, Oregon grape, and rhododendron understory; bigleaf maple, western redcedar, grand fir (Abies grandis), red alder, salmonberry and oxalis (Oxalis spp.) in riparian areas.
It should be noted that USEPA’s inclusion of bigleaf maple (rare on the coast) in the coastal lowlands and uplands subregions and their exclusion of Port-Orford-cedar (common on the coast) are not accurate within the project area.
Table 3 provides a comparison of range, size, maximum age, and economic, historical and ecological uses of the ~15 dominant tree species in the project area. Other information not included in the table is provided below. Table 4 provides the same information for the most commonly found shrub and herbaceous species in the project area.
Douglas-fir is the most common tree in the Pacific Northwest, and prefers deep, moist sandy loam soils (Randall et al. 1981). The tallest known living specimen (the ‘Doerner Fir’ at 327 ft) is found in Coos County. Douglas-firs are the most important timber species in the nation due to their high timber yields and use in structural lumber (e.g., dimensional lumber and plywood)(Randall et al. 1981). Historically, regular fires would clear most species save Douglas-fir (due to its thick bark), creating nearly pure old-growth Douglas-fir stands (with the also fire-resistant Port-Orford-cedar trees in their range)(Hermann and Lavender 1990).
Port-Orford-cedar is only found in the coastal region from southwestern Oregon to northwestern California and is highly susceptible to Port-Orford-cedar root rot (see Disease/Damage section below). It is a shade-tolerant slow growing species. There are climax communities where Port-Orford-cedar is a dominant species and is commonly associated with western hemlock (Zobel 1990). Old-growth Port-Orford-cedars develop thick bark, allowing them to be highly fire resistant (Franklin and Dyrness 1973).
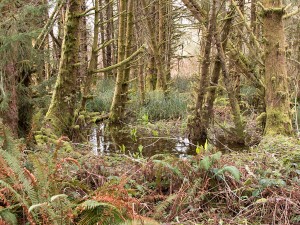
Sitka spruce swamp
Forested swamps are distinguished by a high water table for all or most of the year (e.g., tidal freshwater wetlands, near beaver dams). Common dominant tree species found in forested wetlands are Port Orford and western redcedars, red alder, Sitka spruce and Pacific willow. Moss, liverworts and lichens can make up a high percent of the ground cover (e.g., 85% in coastal British Columbia).
Once common in the Pacific Northwest, forested swamps such as Sitka spruce swamps are now one of the rarest wetland types in the region. These communities have largely disappeared due to timber harvesting and high sediment deposition from historic logging, conversion of wetlands to agriculture, and the naturally slow recovery times associated with forested wetlands.
Sources: Peterson et al. 1997, Adamus et al. 2005
Sitka spruce is the largest spruce in the world (Randall et al. 1981). It is a shade-tolerant fogbelt species and is highly susceptible to decay when damaged. It’s rarely found more than 50 miles from the ocean and is found in moist or boggy sites (Harris 1990; Pojar and MacKinnon 1994; Randall et al. 1981).
Western hemlock prefers deep, moist, well-drained soils (Randall et al. 1981). A shade-tolerant tree, it requires significant organic content in the soil. The thin bark of this species makes it vulnerable to damage from logging and fire (Pojar and MacKinnon 1994; Randall et al. 1981).
Western redcedar is a very shade-tolerant species. It can reach considerable sizes, and is second only to the sequoias and redwoods as the largest tree in the world (Pojar and MacKinnon 1994).
Shore pine is the common name used when this species occurs near the ocean, where wind stress contorts these trees into malformed, twisted shrubs that rarely grow higher than 45 ft (Randall et al. 1981). Known as the lodgepole pine in the Cascades, this species ranges from southern Alaska to Baja, California, making it the widest ranging conifer species in North America (Randall et al. 1981). On the coast, this species can be found in dunes and in coastal swamp or bog habitats due to its tolerance to low nutrient conditions and salt spray (Pojar and MacKinnon 1994; Randall et al. 1981). However, this species is very intolerant of shading from other species (Lotan and Critchfield, 1990).
Red alder is a deciduous tree. It is one of the few tree species that can fix nitrogen, the result of a symbiosis between its root nodules and bacteria (Harrington 1990). Alder can tolerate poor drainage conditions and some flooding so are often found along stream banks or in swamp/marsh habitats (Harrington 1990). Shade intolerant, red alder is a pioneer species that grows abundantly and rapidly in disturbed areas (Franklin and Dyrness 1973).
Disease/Damage
The two diseases causing the most damage to forests in the project area are Swiss needle cast (SNC) and Port-Orford-cedar root rot (POCRR). Except where otherwise noted, the following information on SNC comes from OSU’s Swiss Needle Cast Cooperative (SNCC 2014) while information on POCRR originates from Hansen et al. (2000).
Figure 21. Acres of damaged forest land caused by insect, disease or environmental events. Data collected during annual summertime aerial surveys (July-September) in the project area. Data: USFS 2014.
First discovered on a plantation in Switzerland in the 1920’s, SNC is caused by the native fungus Phaeocryptopus gaumannii, which attacks Douglas-fir trees. Diseased trees develop yellow needles, reduced needle retention, reduced tree diameter and height, and sparse crowns. Caused by an historically present pathogen, SNC was not considered a problem until the mid-1980’s – likely due to changes in forest management practices. Sixty years ago Douglas-fir made up ~ 20% of a diverse forest landscape that included hemlock, cedar, alder and spruce, stands. Douglas-fir is now frequently the dominant species in these same forests (Shaw 2008). Oregon forests closer to the coast tend to have the highest incidence of SNC due to moist climate conditions and mild winter temperatures.
Betlejewski at al. (2011) and USFS (n.d.) describe POCRR as a disease caused by the non-native pathogen Phytophthora lateralis, which primarily infects Port-Orford-cedar trees (can also infect the native Pacific yew, Taxus brevifolia). First seen in Oregon’s Port-Orford-cedar forests in 1952 and likely introduced from infected soil from a nursery, P. lateralis is a fungus-like mold (closely related to brown algae) that actively swims in water during one part of its life stage (zoospore), enabling it to infect tree roots. Hyphae (long, branching filamentous structures) from the mold then spread up roots, killing the phloem of the roots as they advance into the trunk. First signs of infected trees are a change in foliage from green to yellow or light brown, followed by foliage withering and then death. Infected seedlings can die within weeks of infection, while larger trees can take several years. In many areas, larger trees have died from this pathogen, dramatically changing the age/size distribution of Port Orford dominated forests.
POCRR is primarily spread as zoospore-carrying water moves downhill through forest soils. It is also spread through the transport of infected soils (e.g. animal paws/hooves and human boots, particularly the boots of those who harvest Port-Orford-cedar boughs, or car and truck tires covered with infested soil transported to uninfected areas). The pathogen has now spread to nearly all forests containing Port-Orford-cedar and there is no known way to eradicate it. Most heavily affected Port-Orford-cedar stands are those located in riparian and wetland zones where the pathogen can easily spread via water.
Forest management practices have been employed to help prevent spread of the disease, including: wet-season road closures; harvesting and moving heavy equipment in dry season only; washing vehicles before entering uninfected areas; contouring road surfaces to direct surface water away from Port-Orford-cedar stands; and planting trees on sites unfavorable to disease spread (e.g., upslope of roads).
There are diseases not currently a problem in the project area which may affect the project area in the future (e.g., sudden oak death). These diseases are discussed in this chapter’s climate change summary.
Insects
Douglas-Fir beetles (Dendroctonus pseudotsugae), Douglas-fir engravers (Scolytus ventralis), and flatheaded fir borers (Melanophila drummondi) are all beetles that attack Douglas-fir trees (the flatheaded fir borer can also infest spruce and western hemlock). These beetles are all attracted to and more easily infest already stressed trees (e.g. shocked trees on the edge of a recently opened stand; or stress due to drought). Beetle infestations are more likely to occur when downed wood is available to provide a suitable breeding ground for the beetles (e.g., when large slash is left after logging operations)(Flowers and Kanaskie 2007a, 2007b, 2007c).
Douglas-fir beetles can kill large diameter trees by feeding under the phloem layer, allowing sapwood to be infiltrated by wood-decaying fungi (Flowers and Kanaskie 2007a). Flatheaded fir borers are responsible for a
substantial amount of large tree mortality in Oregon and can top-kill or infest and kill the entire tree (Flowers and Kanaskie 2007c).
Douglas-fir engravers tend to kill smaller trees or cause branch mortality and top-kill in larger trees (Flowers and Kanaskie 2007b). For any of these pests, the best management method to prevent outbreaks is to manage
forests for high stand vigor. Thinning (selecting for non-Douglas-fir species), removing windthrown or downed logs and removing large diameter slash are some methods to accomplish this.
Bears
According to Kanaskie et al. (2001), black bears peel tree bark and eat the cambium layer (inner tissue) in springtime. Bear activity can reduce the growth rate and health of trees, cause decay (lowering wood quality and value) or lead to mortality (most common when bears girdle the tree).
Table 3. Range, size, age and uses of the most common tree species in the project area. Sources: Randall et al. 1981, Pojar and MacKinnon 1994, Harris 1990, Harrington 1990; range maps from Wikipedia. * Diameter at breast height.
Table 4. Range, size, and uses of the most common understory species in the project area. Sources: Garrison and Smith 1974, Randall et al. 1981, Pojar and MacKinnon 1994, Tirmenstien 1990