Butter and gaper clam populations in some areas of lower Coos estuary and South Slough have increased since a similar assessment in the 1970s.
Native littleneck clams and cockle populations have generally fallen since the 1970s in the areas sampled.
Population shifts of any estuarine-dependant animals should be cause for further investigation to understand potential causes of change. Source: ODFW 2014
Figure 1. 2009 ODFW SEACOR study areas located in the South Slough (SS) and Lower Bay (LB) subsystems.
Butter clam
What’s happening?
Recreational clamming is an important part of our area’s quality of life. To improve understanding of clam population size and distribution in the Coos estuary, Oregon Department of Fish and Wildlife’s (ODFW) Shellfish and Estuarine Assessment of Coastal Oregon (SEACOR) project documented in 2008-09 the status of four recreationally important bay clam species in the lower Coos estuary- South Slough (SS) and Lower Bay (LB) subsystems (see Figure 1): gaper clams (Tresus capax); butter clams (Saxidomus gigantea); native littleneck clams (Leukoma staminea); and cockles (Clinocardium nuttallii).
Project scientists estimated the distribution and abundance of each species within the SEACOR study sites and described the habitat requirements for each. The results of this work are summarized in Table 1 (ODFW 2014). The ODFW report summarizes results from their detailed assessment method (DAM) at three study sites: South Slough, Clam Island and Pigeon Point. Rapid assessment method (RAM) data from other sites (Empire, Airport and North Spit) were deemed preliminary data only (see Background). Italicized text below indicates sections quoted directly from the ODFW (2014) report unless otherwise noted.
Littleneck clam
Gaper clam
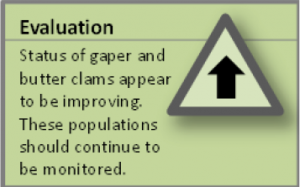
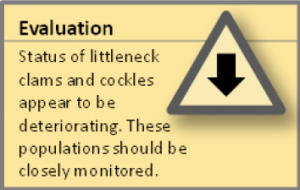
Table 1. Mean clam density data per meter squared for three SEACOR study areas in the lower Coos estuary. ODFW 2014.
Cockles were found in relatively high densities only in the South Slough study area (Figure 4, Table 1), while native littleneck clams were found only in low densities at all three sites, the most dense being Pigeon Point (Figure 5, Table 1).
The low densities of littleneck clams in the 2009 SEACOR study contrasts with earlier surveys conducted in the 1970s when native littleneck clams were found to be reasonably abundant in the Coos estuary. Additional detail, organized by study sites, is found in ODFW’s SEACOR final report (2014):
Clam Island supported high densities and diverse assemblages of bay clams (Figure 6). Butter clams were abundant across all tidal strata at Clam Island (site mean=4.6 clams/m2). Cockles were least abundant at Clam Island, compared to the other tide flats surveyed by DAM, and were most abundant in the mid-intertidal (mean = 0.6 clams/m2).
Gaper clams exhibited the greatest densities at Clam Island (mean=19.9 clams/m2) and were most dense in the low intertidal (mean=45.6 clams/m2). Native littleneck clams exhibited low densities at all three sites (mean=0.7 clams/m2), including Clam Island (mean=0.4 clams/m2).
Pigeon Point exhibited the highest densities of butter clams (Figure 7), particularly at high tidal elevations (H, mean=15.0 clams/m2) in sandy areas commonly referred to as “butter bars.” Cockles were not very abundant at Pigeon Point (mean=1.0 clams/m2), and were most prevalent in the mid tidal stratum at Pigeon Point (mean=2.2 clams/m2).
Gapers were less abundant at Pigeon Point compared to Clam Island (mean=3.1 clams/m2). Low tidal elevations harbored the greatest densities of gapers across all sites (mean=19.3 clams/m2) including Pigeon Point (mean 8.2 clams/m2). Littleneck clams exhibited the highest densities at Pigeon Point (mean=1.4 clams/m2), where they showed little difference in density among tidal strata.
South Slough exhibited the lowest density of butter clams (mean=2.1 clams/m2), but they were still abundant compared to other clams such as cockles and littlenecks (Figure 8). The highest densities of cockles occurred at South Slough (mean=1.5 clams/m2), particularly in high and low tidal elevations (mean=2.0 clams/m2 and 1.6 clams/m2, respectively).
The largest cockles were also collected at South Slough (mean shell length=70.2 mm). Gapers were least abundant at South Slough (mean=1.8 clams/m2) among the three sites sampled by DAM.
Generally, gaper clam length increased with decreasing tidal stratum except at South Slough, which lacked smaller gaper clams. Littleneck clams were least abundant at South Slough (mean=0.3 clams/m2)(Figure 8) and were entirely absent at many waypoints surveyed by DAM.
Figure 2. Gaper clam abundance and distribution in SEACOR study areas Data from Empire, Airport and North Spit sites are considered preliminary only. Data: ODFW 2014.
Figure 3. Butter clam abundance and distribution in SEACOR study areas. Data from Empire, Airport and North Spit sites are considered preliminary only. Data: ODFW 2014.
Figure 4. Cockle abundance and distribution in the SEACOR
study areas. Data from Empire, Airport and North Spit sites are considered preliminary only. Data: ODFW 2014.
Figure 5. Littleneck clam abundance and distribution in the SEACOR study areas. Data from Empire, Airport and North Spit sites are considered preliminary only. Data: ODFW 2014.
Figure 6. Clam distribution and abundance (clams/m2) at the SEACOR Clam Island study site. Note the difference in scale for each clam species. Data are from DAM surveys only. Data and figure: ODFW 2014.
Figure 7. Clam distribution and abundance (clams/m2) at the SEACOR Pigeon Point study site. Note the difference in scale for each clam species. Data are from DAM surveys only. Data and figure: ODFW 2014.
Figure 8. Clam distribution and abundance (clams/m2) at the SEACOR South Slough study site. The scale for each clam species is the same. Data are from DAM surveys only. Data and figure: ODFW 2014.
Figure 9. Intertidal bed type in the SEACOR study areas. Data: ODFW 2014.
Figure 10. Major sediment type in the SEACOR study areas. Data: ODFW 2014.
Figure 11. Eelgrass cover in the SEACOR study areas. Data: ODFW 2014.
Figure 12. Tideal height range in the SEACOR study areas. Data: ODFW 2014.
The presence of algae on clam beds was negatively correlated with the presence of butter clams- these clams were almost always found in non-vegetated sand flats.
The presence of algae in clam beds was positively correlated with the presence of cockles and with the presence of gaper clams.
Cockles and littleneck clams were most frequently found in oxygenated clam bed sediments.
The presence of gaper clams was negatively correlated with sediment temperature “at depth” (the depth in the sediment where those clams are normally found). So, the higher the sediment temperatures were, the fewer gaper clams were found. Gapers were found in greatest abundances in low intertidal flats.
The presence of native eelgrass beds (Zostera marina) was positively correlated with the presence of littleneck clams (in the few areas they were found).
Why is it happening?
The status of clam populations is a function of a variety of environmental conditions including but not limited to bathymetry (shape of the estuary bottom), human activities (e.g., commercial oyster culture, dredging of the commercial shipping channel), and the health of other key benthic and pelagic communities such as eel grass beds and crustaceans (Carlton et al. 1991; Yocom and Edge 1929).
Furthermore, the status of local environmental conditions is determined by many changing elements associated with both natural and human-induced changes. For example, the effects of major storms or the establishment of an oyster culture system have the potential to change the bathymetry of an area via sedimentation or scouring of the estuary bottom. These same actions may also affect the health of nearby eelgrass communities (Carlton et al. 1991). Determining the effects of these activities is a complicated process requiring collection of quanitative data over multiple time periods.
Figure 13. Locations of all previously conducted clam surveys in Coos Bay
Detailed comparisons between studies conducted during different time periods are made difficult by gaps in the data. For example, only two published clam surveys of Pony Slough have been completed, with the most recent data coming from the 1970s (Macdonald 1967; Bottom et al. 1979). Additionally, some areas such as the Upper Bay subsystem, for which the Marriage study (1958) represents the most current data, have not been surveyed for many years. Methodological differences between studies further complicate comparisons between data sets from different studies.
These difficulties notwithstanding, the available historic data are useful in that they provide a snapshot of the status of clams over time. Comparisons of historic data may be valuable in instances where methodological differences in and of themselves are unlikely to account for overwhelmingly clear trends over time.
Historically, clams have demonstrated a wide range of adaptations to the environmental conditions of the study area. In 1929, Yocom and Edge observed a total of forty-one bivalve species in the area between Sunset Bay and Fossil Point (Figure 14). Despite having surveyed a variety of substrata (e.g., rocks, sand, mud, mixed sand and mud, and driftwood) with diverse habitat characteristics (e.g., exposure to ocean waves, varying levels of tidal current and sedimentation, etc.) each area studied exhibited high biodiversity, with twenty-seven different species of bivalves occurring between Coos Head and Fossil Point alone (Figure 15).
Figure 14. Survey area for Yocom and Edge (1929) is highlighted above in green.
Figure 15. Relative diversity of clams in three inventory subregions. CH = Coos Head SS = South Slough FP = Fossil Point Data: Yocom and Edge 1929.
Some historic trends in local clam populations are apparent. The decline of soft shell clams (Mya arenaria) between the 1920s and the 1950s is apparent when comparing the findings of Yocom and Edge (1929) with those of Marriage (1958).
Yocam and Edge noted an abundance of soft shell clams in South Slough in 1929 while Marriage found no soft shelled clams in the same area nearly thirty years later.
Marriage also surveyed North Slough and Haynes Inlet, where soft shell clams were found in scattered beds. It should be noted that the North Slough and Haynes Inlet soft shell clam populations were much smaller than those of earlier years in the same areas, suggesting that the pattern of population decline may well have been characteristic of the greater Coos estuary during these years (Marriage 1958).
In the case of butter and gaper clams at Pigeon Point and Clam Island, the data suggest that the populations of these species may have decreased since the 1970s (Figures 16 and 17). This decline is due to a decrease in clam abundance on Clam Island; although the decline is partially offset by increases at Pigeon Point and may be subject to some variation in magnitude due to methodological differences across studies, it seems likely that the net effect is negative (ODFW Shellfish Program 2009).
Figure 16. Gaper clam abundance data from a 1979 report (A) are compared to the same data from a study conducted in 2009 (B). Data: ODFW 2014.
Figure 17. Butter clam abundance data from a 1979 report (C) are compared to the same data from a study conducted in 2009 (D). Data: ODFW 2014.
From the SEACOR report summary (ODFW 2014, unless otherwise noted):
SEACOR is funded by Oregon Department of Fish and Wildlife recreational shellfish license fees and captures a snapshot of the status of Oregon’s estuarine resources for baseline data and for comparison to past (ODFW 1970’s “raccoon” report: Bottom et al. 1979) and future studies. The SEACOR project initially targeted intertidal flats of the lower Coos Bay Estuary during 2008-2009. However, the state legislature has made the project permanent to allow future assessment of all of Oregon’s estuaries following this general sampling strategy (ODFW Shellfish Program 2009).
Coos Bay was selected as SEACOR’s pilot site because it is Oregon’s largest outer coast estuary, has a long history of supporting recreational and commercial clam harvest, and has experienced increasing urbanization and industrialization since the late 1800s. Coos Bay is a proposed site for a large liquid natural gas facility which would require additional dredging of the channel, an activity that first occurred in 1927. The increasing importance of Coos Bay as a shipping port since its early colonization resulted in physiographic changes primarily from dredging and filling as well as community compositional changes from introductions and extractions. Updating our understanding of estuarine habitats and the distribution and size of Coos Bay bay clam populations was valuable and necessary in the face of these changes in habitat and community structure.
This 18-month study focused on six study sites which encompassed three tidal strata (low, mid, high)(Figure 1). These sites were identified by a “scouting” method not employed with the subsequent estuary studies. Scouting was accomplished using a team transect approach. Team members spaced 10 m apart recorded habitat information every 10 m along transects from shore to channel. The team was repositioned every 100-300 m along the shore of lower Coos Bay. Based on scouting, study sites were selected for sampling when the following criteria met: (1) the area was composed of unconsolidated sediment suitable for burrowing organisms, (2) the area was located in the marine-dominated region of the estuary (Davidson 2006), (3) the area was large enough to support a statistically viable number of samples, (4) the area was known to be or likely to be used by recreational shellfish harvesters, and (5) the area was likely to support clam species at some population level, based on previous studies. This last criterion highlights a key change made for future estuarine studies. Entire tidal flats were surveyed in Tillamook Bay instead of targeting clam bed areas as was done for the Coos Bay pilot study.
The six study sites are described by ODFW (2014) as follows:
The Airport study site is composed of several contiguous extensive tide flats that border the Southwest Oregon Regional Airport runway on three sides and a section of the shoreline that extends south. On the northern border of the Airport runway, there is an extensive, sandy, shrimp-dominated tide flat. To the west of the Airport, there is a heterogeneous and broad tide flat that forms a small peninsula. The peninsula is composed of soft mud close to the runway and to the east, sand at the western edge, a small terrestrial island in the center, and a mixed sediment eelgrass habitat to the far south.
The Clam Island study site is emergent only at lower tides and is entirely isolated from land by water during all tides. It is bordered by an unmaintained channel to the west (demarcated by pole markers at the north and south end of the island) and by the federally-maintained navigational channel to the east. The southern end is lower in tidal elevation than the northern end, and there is a depression at the southern end with abundant eelgrass. This study site is a popular target of recreational clammers, and the adjacent channels are popular for recreational crabbers, as well.
The Empire study site is a relatively narrow strip of two distinct tide flats partially separated by a small dune headland. The larger portion of this site is to the south and the entire site is bordered to the east by low-lying dunes and densely-urbanized variable neighborhood.
The North Spit study site is dominated by four cobble-dominated terrestrial islands, surrounded by areas of soft mud and other areas of sand. The western border is the sand peninsula that encloses Coos Bay. The dune area to the north of the study site was lightly-developed with industrial buildings, and is a natural area with limited public access (i.e. four-wheel drive on sand or boat access only). This lightly-developed industrial area to the north (Jordan Cove, specifically) is the proposed location of a new liquid natural gas facility.
The Pigeon Point study site is the most heterogeneous, with separate areas dominated by cobble, nearly pure sand, and nearly pure mud. There are several dredge spoil piles that are not emergent at standard high tides composed largely of cobble that form a barrier across the edge of the site; this separates the bulk of the exposed tide flat from the shipping channel. There are two permanent pools, one to the north that is shallow and is highly vegetated with eelgrass and algae and a second pool in the central area that is filled with soft mud and light vegetation. This site is named after “Pigeon Point,” a highly-developed residential neighborhood that borders the south edge. The eastern edge is also highly-developed with residential buildings. In contrast, the northern border is a low-lying dune habitat situated on landfill. Access to this site is fairly easy, with paths leading down the bluff face at both the northern and southern ends.
The South Slough study site refers to an area that contains three discrete tide flats with the largest of the three locally called the “South Slough Flat”. The “South Slough Flat” is bordered by the Charleston Bridge at its northern edge, the Metcalf Marsh at its western edge and by the lightly-developed forested bluff known as Collver Point, to the south. There is a large cluster of hummocks (raised areas), vegetated with salt marsh plants that are entirely submerged only at extreme high tides. There are also two major drainage channels from the Metcalf Marsh, one to the south and one to the north of the hummock cluster. There is abundant eelgrass (Zostera marina) in the lower intertidal areas. This site is a very popular area for clammers. It is also subject to harvest by small-scale commercial clammers harvesting cockle clams, and other fishermen harvesting burrowing shrimp for bait. The South Slough study site also includes the smaller “Charleston Triangle” and “Fisherman’s Grotto” (a restaurant at the access point) tide flats, which were only sampled during RAM surveys. Both of these tide flats are located just north of the Charleston Bridge, are heavily used by clammers, and are adjacent to the marina and fish processing plants.
This study assessed 450 ha of tide flats of which 150 ha were surveyed by DAM. RAM surveys were conducted at all 6 study sites, whereas DAM surveys (n=45 sites) were only conducted in Clam Island, Pigeon Point, and South Slough. The SEACOR results focus on these three flats. All results are detailed in the SEACOR Coos Bay Final Report (in prep.).